
ConstructVue Academy · Lesson 8
Construction reporting: one record, one set of numbers
Reporting that is generated, not assembled — a weekly project summary drawn straight from the live record, how to read trends honestly, and how to share the same numbers with lenders, owners and the project team.
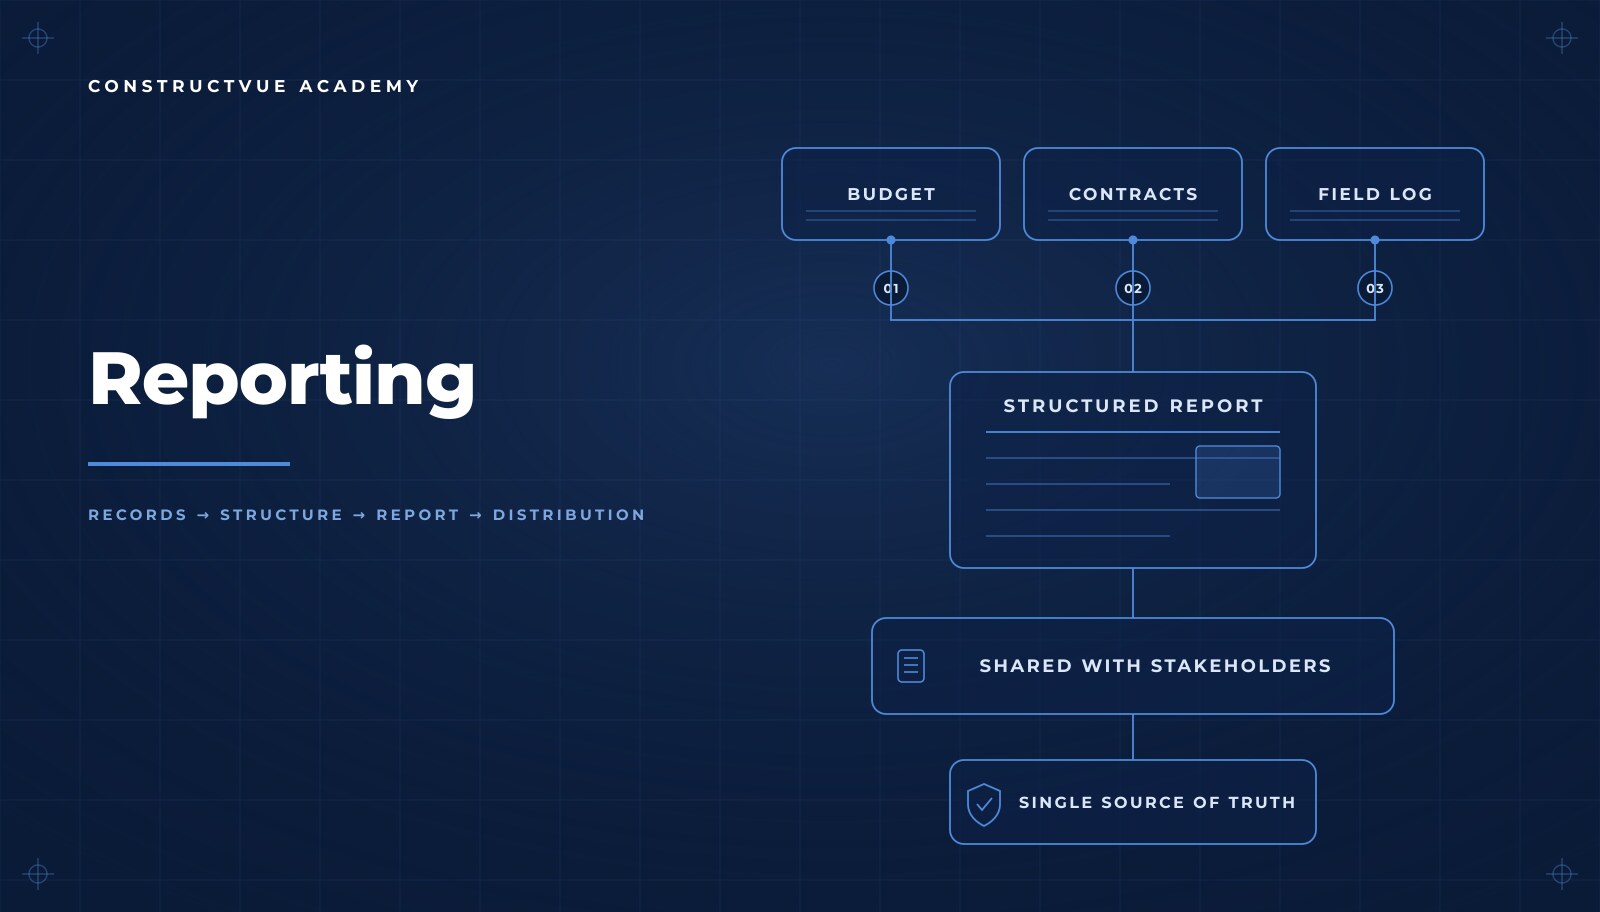
Reporting is where a construction company's discipline becomes visible to people outside it. Lenders, owners and boards do not see the daily record; they see what is sent to them. If that package is assembled by hand each month, what they are really reading is a summary of one person's interpretation on one afternoon.
A report that is generated rather than assembled changes the conversation. It carries a generation date and a report ID, it draws every figure from the live record, and it can be reproduced by anyone with access. Nobody has to ask whether the numbers were updated before the meeting.
Learning objectives
- Generate a weekly project summary directly from the live record instead of assembling one.
- Read financial position, schedule and quality, and workflow load as one coherent picture.
- Interpret cost by trade against budget, committed and paid.
- Read trends by direction of movement rather than by the size of a single figure.
- Distribute one report to lenders, owners and the project team rather than three curated versions.
- Keep the live record — not the report — as the operating surface.
Building the report
The weekly project summary is a printable snapshot organized the way a reader actually needs it. Financial position comes first: original budget, revised budget, committed cost, paid to date, forecast at completion and funding. Then schedule and quality — task completion, overall progress, inspections passed and failed. Then workflow load — invoices in workflow, contracts on file, approved change orders, open RFIs.
Cost by trade
Beneath the summary, cost by trade shows budget, committed and paid for each trade on the job. This is usually the first place a reader finds the real story: a trade fully committed at ten percent progress, or a trade with no commitment at all six weeks before it is needed.
Generated, timestamped, reproducible
Each report carries the date it was generated and an identifier. That is what makes it a record rather than an artifact — two readers holding the same report ID are holding the same data, and the figures inside it trace back to the project controls records that produced them.
Understanding trends
A single report is a position. A sequence of reports is a trend, and trends are where decisions live. Read the direction before the magnitude.
- Committed cost rising faster than progress — the job is buying faster than it is building.
- Forecast at completion drifting above the revised budget — the outlook moved before the overrun did.
- Inspections failing repeatedly in one trade — a quality problem that will become a schedule problem.
- Invoices accumulating in workflow — an approval bottleneck, not a cash problem.
- Contracts outstanding against awarded work — mobilization risk hiding in the paperwork.
Sharing information
Reports are printable snapshots meant for lenders, owners and project meetings. Send the same package to all three where you can. Curated variants feel diplomatic and end with three parties managing three different projects.
Who can see what is governed by role and workspace permissions, as covered in the roles and permissions lesson. Distribution is a permission question before it is an email question.
Reporting discipline
Report on a cadence, manage continuously
A weekly report is a checkpoint, not a management method. Teams that manage from the report between checkpoints are managing a copy.
Do not fix the report; fix the record
When a figure in a report looks wrong, the correction belongs in the record that produced it. Editing the output is how two versions of a project begin.
Frequently asked questions
What belongs in a weekly construction project report?
Financial position — original budget, revised budget, committed cost, paid to date, forecast at completion and funding. Schedule and quality — task completion, overall progress, inspections passed and failed. Workflow load — invoices in workflow, contracts on file, approved change orders and open RFIs. Together they answer where the money is, whether the work is on track, and what is waiting on a decision.
Should reports be assembled by hand?
No. A report assembled by hand is a snapshot of someone's interpretation on the day they built it. A report generated from the live record carries a generation timestamp and a report ID, which means two people reading the same report are reading the same data — and any figure in it can be traced back to the record that produced it.
How do you read a trend honestly?
Compare like periods, and read the direction of movement rather than the size of the current number. Committed cost rising faster than progress, forecast drifting above the revised budget, or inspections failing more often than they pass are all trends that appear well before they appear as an overrun.
Who should receive project reports?
Lenders, owners and the project team, and normally the same report rather than three curated versions. Divergent reporting packages are how three parties end up managing three different projects. Share scope is governed by role and workspace permissions, not by which attachment someone forwarded.
Is reporting a substitute for the live record?
No. A report is a printable snapshot for a meeting, a draw or a board pack. The live record remains the operating surface. If people manage from the report rather than from the record, the report starts drifting the moment it is generated.
Related Academy lessons
To see the records these reports are generated from, see the reporting and project intelligence capabilities, or return to the Academy hub for the full series.
Lesson chapters
- 0:04Welcome
- 0:22Building reports
- 0:56Understanding trends
- 1:23Sharing information
- 1:47Next steps