
ConstructVue Academy · Lesson 7
How construction executives read performance across projects
The executive view adds no new data — it reads the records teams already maintain. Consistent portfolio measures, rule-based risk findings, and an operational feed that explains why a number moved.
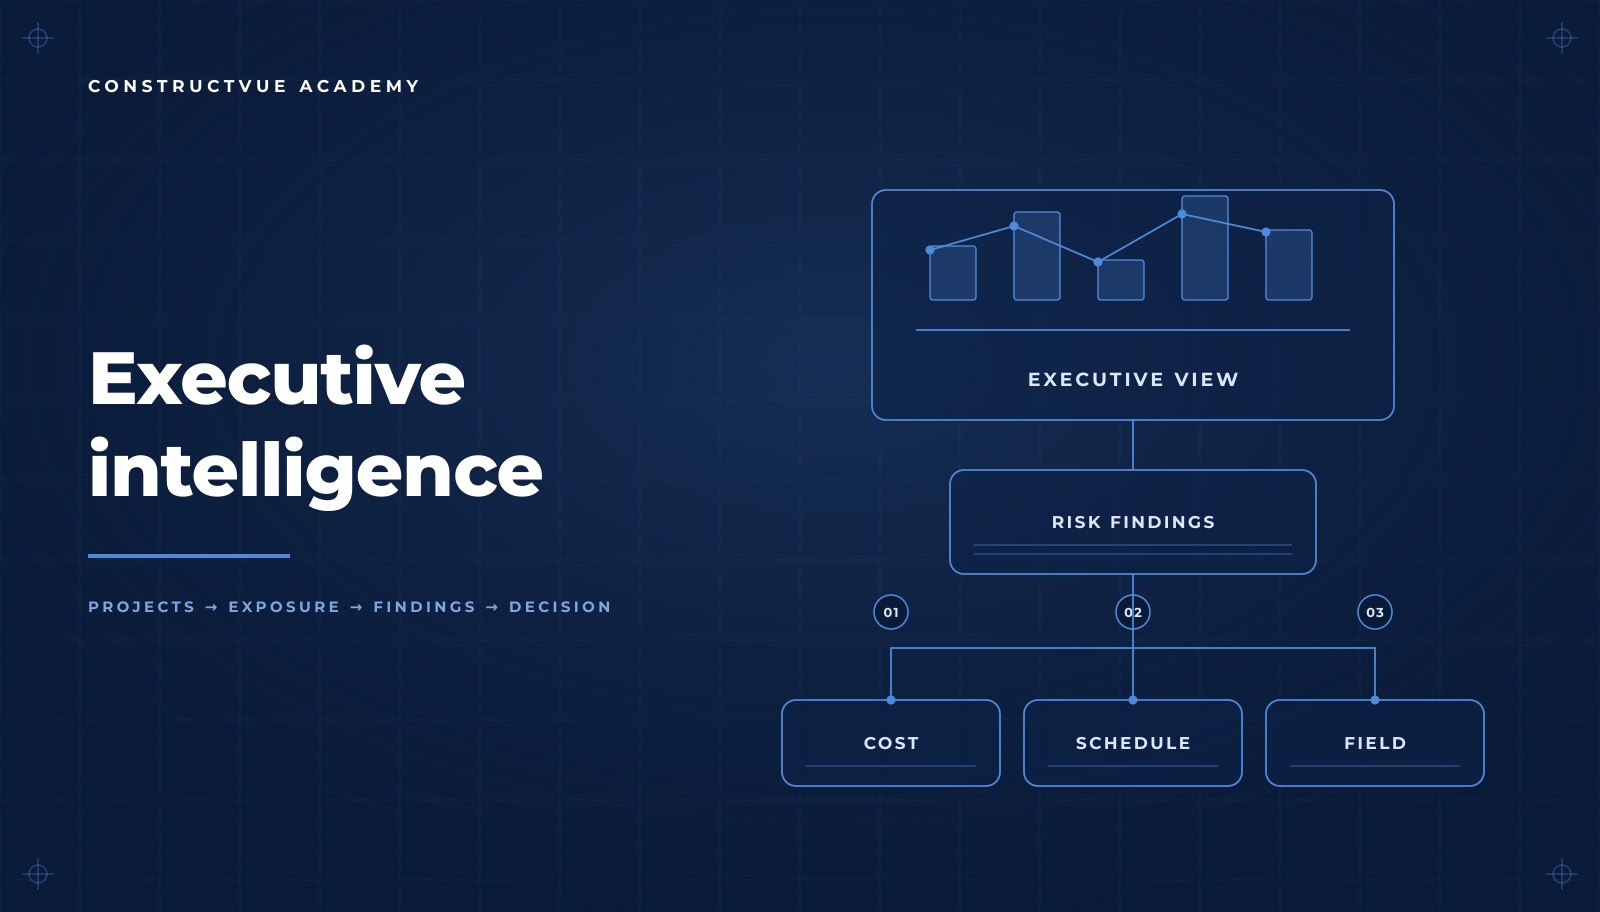
Most construction executives do not lack information. They lack information they can trust without a phone call. The weekly deck is assembled by hand, the numbers in it are a week old, and the person who assembled it is the only one who knows which cells were estimated. By the time a question is answered, the answer is stale.
The executive view described in this lesson adds no new data. It reads the records the teams already maintain — the budget, the commitments, the contracts, the schedule and the field log — and presents them consistently. That single property is what makes it useful: there is no second version of the truth to reconcile.
Learning objectives
- Read a portfolio where every project reports the same measures, taken the same way.
- Prioritize by exposure rather than by volume of activity.
- Interpret a forecast as movement against the revised budget rather than as a fixed number.
- Use rule-based findings that name the record behind them instead of composite scores.
- Use the activity feed to explain why a number moved.
- Move from a summary straight into the underlying record without leaving the system.
Portfolio visibility
Start with the portfolio. Every project you have access to is listed in one place, and each reports the same measures: original budget, revised budget, committed cost, paid to date. Consistency is what makes projects comparable. When each project manager chooses their own definition of committed, the portfolio total is arithmetic performed on four different meanings.
Read the exposure columns first
The summary counts how many projects are behind schedule and how many are over budget. Those two counts are the agenda. A project generating a lot of activity is not the same as a project generating a lot of risk, and executive attention is the scarcest resource on the list.
Then open the record
Every row opens into the project itself. Summary to detail should never require a different system or a request to someone else — the moment a question needs a human intermediary, the answer arrives after the decision.
Risk and forecasting
Risk shows up as movement. The forecast at completion is read against the revised budget, so a shifting outlook is visible while it is still a trend rather than an overrun. A single forecast number tells you where you think you will land. The sequence of forecasts tells you whether the project is under control.
Findings are rule-based. Each one names a condition and the record that produced it — a late task with dependent work behind it, a failed inspection, a subcontractor whose insurance has expired while their crew is scheduled to mobilize. Because a finding points at a record, it can be confirmed and closed rather than argued about. See project controls for how the underlying budget and commitment figures are produced.
Operational intelligence
The activity feed is the project's narrative in order: what changed, in which domain, and what it affects. Financial events, contract state changes, schedule movement, field issues and inspections all land on the same timeline.
- A number that moved is explained by the event that moved it, not by a memory of the meeting.
- Domain filters let a finance conversation and a field conversation read the same feed differently.
- Nothing is retro-edited: the record is a sequence of events, so history stays honest.
- Attention items surface where a human decision is required rather than where activity was highest.
Making it an operating habit
One cadence, one source
If the executive review runs from an exported spreadsheet, the system is documentation rather than management. Run the review from the live record and the meeting becomes about decisions rather than reconciliation.
Ask for the record, not the summary
The most valuable executive habit is opening the record behind a figure once per meeting. It costs a minute, and it is the fastest way to find out whether the discipline underneath the number is real.
Frequently asked questions
What is executive intelligence in construction software?
It is the reading layer over records the project teams already maintain — budgets, commitments, contracts, schedule and field activity. It introduces no separate data entry and no parallel spreadsheet. Every figure an executive sees is the same figure the project manager is working from, which is what makes an executive conversation about the record rather than about whose number is right.
How should an executive read a construction portfolio?
Start with exposure, not volume. Budget, committed cost and paid to date sit side by side for every project, taken the same way, so projects are comparable. Read the counts of projects behind schedule or over budget first, then open the project that carries the most exposure and move straight into its records.
How is project risk detected?
Risk shows up as movement. Findings are rule-based and evaluated against the project's own records: forecast read against the revised budget, tasks running late enough to cascade, failed inspections, expired or missing insurance on an active trade. Each finding names the record that produced it, so it can be confirmed rather than believed.
Why does a rule-based finding matter more than a score?
A composite score compresses several unrelated conditions into one number nobody can act on. A rule names a condition, points at the record, and states what should happen next. Executives do not need a grade; they need to know which of ten projects has an uninsured subcontractor mobilizing on Monday.
What is the activity feed for?
It is the narrative of the project — what changed, why, which domain it touched, and what should happen next. It is what turns a number that moved into an explanation, and it is the difference between a monthly review that reconstructs history and one that reads it.
Related Academy lessons
For the wider system these figures come from, see the platform overview and how owners and developers use this reporting, or return to the Academy hub.
Lesson chapters
- 0:04Welcome
- 0:27Portfolio visibility
- 1:06Risk and forecasting
- 1:39Operational intelligence
- 2:12Next steps